Annual highlights of the broadcasting sector 2021-2022


© His Majesty the King in Right of Canada, as represented by the Canadian Radio-television and Telecommunications Commission, 2023
ISSN 2564-3673
Catalogue No. BC9-33E-PDF
On this page
- Highlights of the broadcasting sector for the 2021-2022 broadcasting year
- Section 1: Traditional commercial and digital media broadcasting undertakings sector revenues
- Section 2: Contributions to Canadian content and programming
- Section 3: Spotlight on Consumers and Diversity
- Section 4: Listening and viewing of broadcasting services
- Section 5: Spotlight on News
- Section 6: Methodology
- Definitions
Highlights of the broadcasting sector for the 2021-2022 broadcasting year
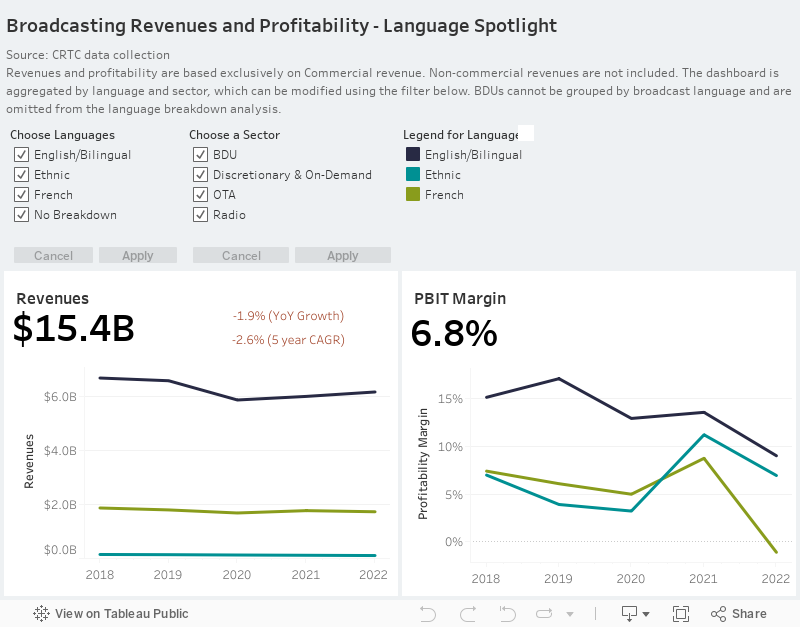
In the 2022 broadcast year (ending August 31st, 2022) Broadcast Distribution Undertakings (BDUs), Discretionary TV, and Radio sectors remained profitable, while Digital media broadcasting undertakings (DMBU) continued to grow their revenue and audience shares. Conventional television reported a decrease in profitability in 2022. In total, broadcasting revenuesFootnote 1 increased by 1.2% from the 2021 to the 2022 Broadcast year.
- Discretionary TV (3.4%) and DMBU (11.1%) sectors reported an increase in revenues.
- Commercial Radio (3.2%) and commercial Conventional TV (5.1%) generated more revenue in 2022 than in 2021.Footnote 2
- BDU reported a 5.3% decrease in revenue in 2022.
- DMBU continued to increase their share of total broadcasting revenues. This trend is consistent with the Media Technology Monitor (MTM) Fall 2022 Adoption report that shows that Canadians have been increasing their use of DMBU services. In 2022, Anglophones (19%) and Francophones (14%) aged 18+ were more likely to watch TV exclusively online.
- In the 2022 broadcast year, Covid-19 assistance to the broadcasting industry decreased substantially and made up only 15% of what broadcasters reported in 2020.
Scroll
View data
Additional data from the 2022 Broadcast year is available in the Communications Market Reports – Open Data and the Financial Summaries for Broadcasting Sector web pages.
Section 1: Traditional commercial and DMBU broadcasting sector revenues
This year, Commercial Conventional Television reported the strongest growth on the traditional side of broadcasting with revenues increasing by 5%. Commercial Radio and Discretionary Television Services both reported 3% revenue increases during the same period. BDU revenues are the one exception, reporting a total revenue decline of 5%. For the digital side of broadcasting, DMBU revenues increased by 11%.
This increase in commercial radio revenue (3%) is the first reported increase since 2017. A large portion of the Radio sector recovery can be attributed to the 11% increase in Local Time Sales ($73M) and the 5% increase in the English-Language sector ($42M).
| Radio Sector | 2021 Revenue ($M) |
2022 Revenue ($M) |
% Change |
|---|---|---|---|
| Total | 1,074 | 1,108 | 3% |
| English-language | 818 | 860 | 5% |
| French-language | 212 | 203 | -4% |
| Ethnic | 43 | 46 | 6% |
| Local Time Sales | 640 | 713 | 11% |
| National Time Sales | 383 | 354 | -8% |
Commercial conventional and discretionary television services reported an increase in revenue compared to the 2021 broadcast year. While there was some additional recovery, in line with trends seen in the 2021 Communications Market Report (CMR), these two sectors are reporting lower revenues than their pre-pandemic levels (2019). Compared to pre-pandemic levels, Commercial conventional television is down 3.7% and Discretionary Television is down 3.4%.
| Television Sector | 2021 Revenue ($M) |
2022 Revenue ($M) |
% Change | |
|---|---|---|---|---|
| Conventional Television Services |
Total | 1,424 | 1,497 | 5% |
| English & Bilingual | 1,157 | 1,210 | 5% | |
| French-language | 255 | 275 | 8% | |
| Discretionary Television Services |
Total | 3,959 | 4,092 | 3% |
| English & Bilingual | 3,225 | 3,350 | 4% | |
| French-language | 671 | 690 | 3% |
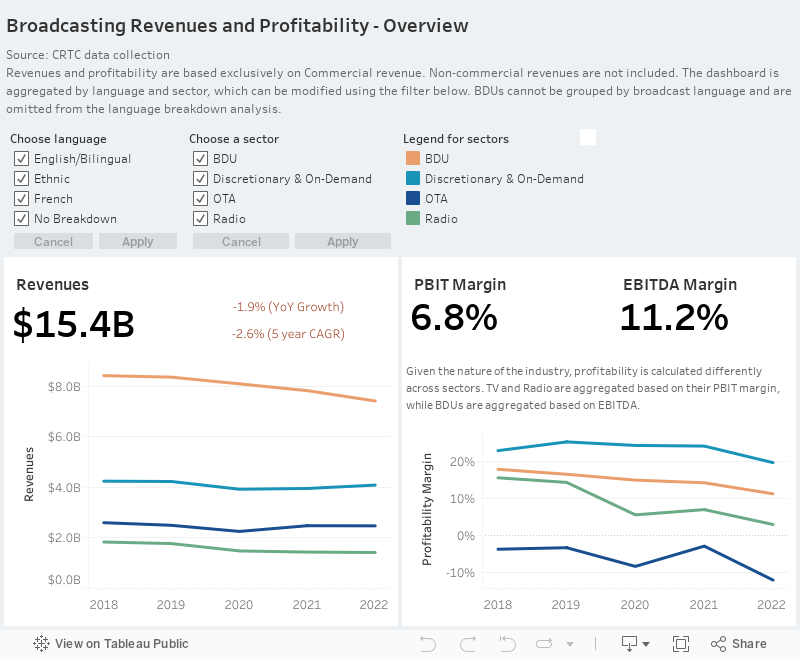
Since 2021, BDU subscribers are down 2.9% and revenue is down 5.3%. The decrease in the BDU sector is mostly in line with historical trends (-2.6% compound annual growth rate [CAGR] in revenue since 2015) and what it set out in the 2018 report: Harnessing Change: The Future of Programming Distribution in Canada.
Scroll
View data
Aggregated data collected in response to the Annual Digital Media SurveyFootnote 3 is included in this CMR for DMBU revenues starting in 2021, whereas previous years use data estimates collected from OMDIA.
- In the 2022 Broadcast year, DMBU audio service revenues increased by 7.3% (31.7% CAGR since 2018) and DMBU audiovisual service revenues increased by 12.3% (12% CAGR since 2018).
Scroll
View data
Profitability
During the 2022 Broadcast Year, all commercial broadcasting sectors reported a decrease in profitability. Radio PBIT margin is down 0.3 percentage points; Discretionary TV PBIT margin is down 4.5 percentage points; Conventional TV PBIT margin is down 5.3 percentage points; and BDU operating margin is down 3 percentage points.
Scroll
View data
- While revenues in most sectors increased in 2022, most sectors reported an increase in their operating costs: 3.8% by radio, 8% by discretionary TV, and 10.3% by private conventional TV. The BDU sector is the one exception, reporting both a decrease in revenues (5.3%) and operating costs (2%).
- Compared to pre-pandemic levels, all sectors remain less profitable. Radio PBIT Margin is down 11.9%; Discretionary Television PBIT Margin is down 5.6%; Conventional Television PBIT is down 10.7%; and BDU Operating Margin is down 5.3%.
- For the television sector, decreases in PBIT have been reported for English, French, and Ethnic stations across Canada. For the radio sector, decreases in PBIT have been reported for French and Ethnic stations, while English Radio stations have reported an increase.
- Conventional television stations owned by smaller commercial broadcasters (those not owned by companies that file aggregate returns) were more profitable in 2022 (14%) than their larger counterparts (-21.5%). Conversely, larger commercial radio stations (those owned by companies that file aggregate returns) were more profitable in 2022 (7%) than smaller radio stations (3.7%). Larger discretionary services (20.2%) were also more profitable than smaller discretionary services (16.3%).
Section 2: Contributions to Canadian content and programming
In the 2022 broadcast year, contributions to Canadian content increased by 11.6% compared to the 2021 broadcast year. Television contributions (Canadian programming expenditures [CPE]) increased by 13.2% and radio contributions (Canadian content development [CCD]) increased by 62.0%. BDUs contributions (Canadian programming) decreased by 1.8%. The large increase in Radio CCD may be due to Broadcasting Decision 2021-274, which stipulates that the radio sector pay 50% of their covid-related deferred CCD contribution no later than 31st August, 2022.
- Combining all required contribution types, the Canadian broadcasting industry contributions to Canadian content are up 5.7% compared to 2012.
- While the radio sector had the most significant decline in contributions (38.8%) since 2012, they reported the largest year over year increase in contributions to Canadian content and programming in 2022.
- The BDU sector contributions have a steadily declined CAGR of 2.5% and are down 22.7% compared to 2012. This decrease is in line with BDU revenue and subscribership declines.
- The combined conventional and discretionary television sectors CPE have been relatively steady over the past 10 years with a CAGR of 1.1%, and have increased 11.6% compared to 2012. Since 2018, expenditures on programs of national interest (PNI), a sub-component of the CPE, have declined at a CAGR of 1.2%.
- Since 2018, expenditures by conventional and discretionary television stations on news programming have increased by 1.7% (or $12.5M) to $749.8M. This amount includes contributions to locally reflective news programming that conventional television stations receive from BDUs, which has averaged $45.2M since its inception in 2018.Footnote 4
- During this same period, radio station expenditures on news programming have increased by 4.3% to $98.2M.
Scroll
View data
Section 3: Spotlight on Consumers and Diversity
Consumers
Canadians are shifting their subscription spending habits away from BDU subscriptions, and Canadians are steadily increasing their spending on DMBU subscriptions. CRTC data collection suggests that the estimated monthly expenditure per household on BDU services have gone down from $36.91 in 2020 to $33.42 in 2022, whereas DMBU expenditures have increased from $22.8 in 2020 to $27.64 in 2022. Footnote 5,Footnote 6 Estimated household monthly expenditures on subscriptions to BDU services continues to decline (CAGR of -3.9% since 2018 and 5.7% decrease since 2021). In contrast, estimated household monthly expenditures on subscriptions to audio and audiovisual DMBU services continue to increase (CAGR of 14.1% since 2018 and 9.9% increase since 2021). While Canadians are spending less on BDU services, Canadian household monthly expenditures on BDU services still outpace expenditures on DMBU services, with households spending an estimated 21% more on BDU services than DMBUs in 2022.
Overall, Canadians are spending more on subscription-based audio and audiovisual services. In 2018, Canadians estimated monthly household expenditures on these services $55.43. This amount has increased to $61.06 in 2022.
Scroll
View data
Scroll
View data
While overall BDU subscribership has been declining gradually, BDU subscribers in the $25 or less price range are up 21.8% over last year, being one source of growth for BDU services this past year.
- 4.5 million Canadians subscribe to BDUs at the $50.01-$100 price range, making it the most popular BDU subscription price range. However, year over year changes show that the more expensive BDU price ranges are reporting a decline in subscribers. Compared to 2021, the subscriptions to the $25-$50 price range is down 6.9%, subscriptions $50.01-$100 is down 3.4%, and subscriptions to the more than $100 price range is down 7.4%.
- DTH subscribers are most likely to subscribe to services of $50 or more. The number of DTH subscribers in the more than $100 price range seems stable, whereas the $50-$100 has seen a loss in subscribers since 2020.
- Cable & Internet Protocol television (IPTV) subscribers are most likely to subscribe to $50-$100 price range. Subscriptions to all Cable & IPTV price ranges are relatively stable. Most have reported small decreases in subscribers since 2020, with the exemption of the $25 or less price range, which reported modest increases in subscribers every year since 2020.
Scroll
View data
To improve accessibility, BDUs, as of February 2022, are expected to provide paper bills upon request, at no extra charge, to customers who self-identify as persons with disabilities or for whom e-billing represents a barrier.Footnote 7
Diversity
Over the past 5 years, the availability of traditional radio stations and television services providing broadcasting media to diverse cultures in Canada has grown steadily (1.7% CAGR since 2018 for all of television and 2.7% CAGR since 2018 for Radio).
Scroll
View data
- Data from the MTM Fall 2022 survey suggests, however, that Indigenous peoples were more likely to subscribe to a subscription-based video-on-demand (SVOD) service (86%) than a paid traditional television service (63%). MTM data also suggest that newcomers were more likely to subscribe to an SVOD service (88%) than a paid traditional television service (52%). Compared to Canadians 18+ (18%), newcomers (46%) and Indigenous peoples (28%) are more likely to only consume audiovisual content over the Internet.
- For audio services, 84% of Indigenous participants and 92% of newcomer participants indicated that they listen to streamed audio services, whereas 77% of Indigenous participants and 46% of newcomer participants indicated that they listened to radio on a traditional receiver. For comparison, listenership, by Canadians 18+, to online or traditional audio remains similar.
Section 4: Listening/Viewing of broadcasting services
Audio
Traditional broadcasting services continues to occupy a major portion of Canadian listening habits. However, since 2015, average weekly hours listening spent listening DMBU audio services has grown. During that time, hours spent listening to traditional broadcasting has decreased at a CAGR of 5.2%, whereas DMBU audio has increased at a CAGR of 11.6%. The tuning data for traditional broadcasting is collected by Numeris and the audio data for DMBU services is self-reported data collected by MTM. Given the different methodologies for data collection, this comparison may not accurately reflect the consumption habits between traditional tuning and DMBU audio.
Scroll
View data
Traditional radio tuning is seasonal, with some months typically performing better than others given the fluctuations of the Canadian radio industry. Over the past three broadcast years (September 2019 to August 2022), the month of May averaged the most tuning hours, whereas the month of April averaged the fewest tuning hours.Footnote 8
MTM includes streaming music, podcasts, and AM/FM Radio in their DMBU audio survey.
- Anglophone Canadians have increased their average hours per week of DMBU audio consumption from 8.21 in 2019 to 10.68 in 2022. Francophone Canadians have increased their average hours per week of online audio consumption from 7.2 in 2019 to 7.33 in 2022.
- Music streaming accounts for 62% of the total DMBU audio consumption for both Anglophones and Francophones. AM/FM streaming is consumed less. AM/FM streaming accounts for 15% of the Online Audio weekly listening hours for Anglophones, whereas it accounts for 26% for Francophones.
- 36% of Canadians aged 18+ indicated that they listen to podcasts. Podcasts seem more popular among Anglophone Canadians (39%) than they do among Francophone Canadians (26%). Podcasts are most popular among younger Canadians. 56% of Canadians 18-34 years of age and 44% of Canadians 35-49 years of age having reported listening to a podcast in 2022. Time spent listening to podcasts has also seen an increase from 1.06 mean weekly hours in 2018 to 2.28 mean weekly hours in 2022.
Scroll
View data
Audiovisual
The Video Audience Measurement (VAM) from Numeris is a new tool available to the Canadian broadcasting industry that can measure consumption of in-home video streaming on all devices. Currently, it only collects data in the Ontario market and the Quebec Francophone market during the 2022 broadcast year. Because VAM only measures these two markets, it would be inaccurate to compare this streaming data to the amount of traditional television consumed across Canada. Instead, the purple line in Chart 12 is a combination of VAM and traditional television viewing data. This method is currently being used to provide an observation about how much total television is being consumed, digitally and traditionally.
- During the 2022 broadcast year, viewing of Canadian traditional television services varied from about 506 million to 685 million average hours per week. After adding the time spent streaming video content by Canadians in the Ontario market and Quebec Franco market, the average viewing hour per week varied from 591 million to 771 million hours per week.
- Traditional television is most popular among Canadians aged 50+, whereas streaming is most popular among Canadians aged 18-49. Additionally, VAM data suggests that Quebec Franco viewers consume more hours of traditional television at all age groups than Ontario viewers.
- Moreover, both streaming and traditional television remain popular in Canada. While MTM reported in its Fall 2022 survey that over 80% of Canadians 18+ streamed some form of video content, they found that 68% of Canadians who subscribe to a SVOD also subscribe to traditional television.
Scroll
View data
Since 2015, the average number of hours spent watching traditional television services has decreased by a CAGR of 3.6% or a total of 22.7%. Last year, it was reported that most of this decrease can be attributed to viewers outside of Quebec. While the trend is similar this year, the difference between these two variables has shrunk. Consumers outside of Quebec have decreased their viewership by 24.5% since 2015, whereas consumers in Quebec reduced their viewing by 17.2% over that time.
Scroll
View data
Section 5: Spotlight on News
From 2013 to 2020, data from MTM suggests that Canadians have begun to consume more online news. Data from 2020 to 2022, however, suggests that this growth has peaked over the last few years.
- On average, all Canadians read more online news than they watch. Data suggests that Canadian Anglophones consume slightly more online news (both read and watch) than Francophones. Both groups, however, have had similar growth patterns since 2013.
- All Canadians aged 18+ report consuming an increasing amount of news online, with Canadians aged 18-49 consuming the largest amount of online news. Canadians aged 65+ consume the smallest amount of online news.
- In 2022, Canadians, Indigenous peoples, and Newcomers all consumed similar levels of online news.
Scroll
View data
As the percentage of Canadians who consume online news continues to grow, the percentage of Canadians who watch a Canadian TV News specialty channel has slowly decreased.
- In 2016, 62% of Canadians answered that they watched a Canadian TV News Speciality Channel, whereas in 2022, this number decreased to 56%.
- This decrease can be seen in Anglophone and Francophone consumers. A comparison of the 2016 and 2022 MTM survey suggests that 3% fewer Anglophone consumers reported watching a Canadian TV News Specialty Channel, while 14% fewer Francophone consumers reported watching a Canadian TV News Specialty Channel. While fewer Anglophone and Francophone Canadians are watching Canadian TV News specialty channels, MTM data suggests that Francophone Canadians are decreasing their consumption of Canadian specialty news at a faster rate.
- Since 2016, Discretionary and Commercial Television Broadcasting expenditures on Canadian News Programming has increased at a CAGR of 1.1% or a total of 6.78%. CBC/SRC expenditures on Canadian News Programming, however, has decreased at a CAGR of 6.63% or a total of 33.72%.
- As mentioned in the section on Canadian Programming Expenditures, TV and Radio broadcasters have been increasing their expenditures on news programming over the past 5 years.
Scroll
View data
Section 6: Methodology
CRTC data collection
The CRTC data collection has sourced its statistical and financial data from the annual returns provided by commercial and CBC/SRC radio stations, conventional television stations, discretionary services and on-demand services, for the broadcast year ending 31 August 2022.
CBC/SRC revenues include parliamentary appropriations for conventional television.
Annual returns for the broadcast year ending 31 August 2022 were required to be filed with the Commission by 30 November 2022. Data received after the compilation date is not reflected in this publication. The data reported for previous years has been updated to reflect any additional or adjusted information received by the Commission after the 31 August date for prior years’ publications.
Pursuant to Broadcasting Regulatory Policy CRTC 2015-86, the term “discretionary services” now encompasses all currently licensed services formerly known as pay and specialty services, whereas the term “on-demand service” now encompasses all licensed pay-per-view and video-on-demand services.
Media Technology Monitor (MTM)
MTM measures Canadians’ media technology adoption and use at two points in time to monitor changes in media penetration and use over the year. Telephone interviews are conducted with a regionally representative sample of Canadians who have a landline telephone service and those who rely solely on cell phone service. The fall survey includes 8,368 Canadian adults (4,379 Anglophones and 3,979 Francophones), 2,795 of which have completed an online survey introduced in the fall. An independent sample of 4,000 Canadians (2,000 Anglophones and 2,000 Francophones) is surveyed in the spring.
The CMR uses data collected from the fall surveys unless stated otherwise.
Omdia (Formerly Ovum)
Download-based audio services
Revenues of download-based audio services are estimated based on publicly available data, such as company annual reports, in addition to Canada’s other media revenues, such as physical music album sales and live music attendance revenues. These estimates are further refined using data about online audio subscriptions in the market as a benchmark.
In some cases where information is unavailable, Omdia based its revenue estimations on service providers’ market shares and revenues reported in a similar country.
Streaming audio services
Streaming audio services use different business models to which different methodologies apply. The total revenues of subscription-based digital streaming, advertisement-based digital streaming, and audio-video streams are added to determine total revenues of streaming audio services.
- Revenues of subscription-based digital streaming services (such as Spotify) are estimated based on publicly available data, including the number of subscribers and service rates/pricing, such as company annual reports and news articles. These are then used to estimate an average monthly subscription revenue per subscriber, considering all available service plans from a given provider, and distributed to the estimated number of subscribers. The estimated average monthly subscription revenue per subscriber is then multiplied by the subscriber estimate.
- Revenues of advertisement-based digital streaming and video streams are estimated based on publicly available data about traffic, advertising load and pricing, as well as video traffic and digital advertising forecasts. These estimates are further refined based on each entity’s performance in other video segments.
Subscription-based video-on-demand (SVOD) services
Revenues of SVOD services are estimated based on publicly available data on the number of subscribers and services rates/pricing, such as company annual reports and news articles. These are then used to estimate an average monthly subscription revenue per subscriber considering all available service plans from a given provider and distributed among the estimated number of subscribers. The estimated average monthly subscription revenue per subscriber is then multiplied by the subscriber estimate.
Transactional video-on-demand (TVOD) services
Revenues of TVOD services are estimated based on publicly available data, such as company annual reports, in addition to Canada’s other media revenues, such as home video and pay television revenues. These estimates are further refined using data on online video subscriptions in the market as a benchmark.
In some cases, where information is unavailable, Omdia based its revenue estimations on service providers’ market shares and revenues in a country similar to the one subject to analysis.
Advertising video-on-demand (AVOD) services
Revenues of AVOD services are estimated using publicly available and, where necessary, quantitatively modelled data (informed by analyst knowledge and assumptions) about advertising load, pricing and market share. These are then applied to video traffic and digital advertising forecast models to derive revenue estimates. These estimates are further refined based on each entity’s performance in other video segments.
Omdia defines AVOD revenue as revenue generated through the sale of in-stream video advertising (i.e., pre-roll, mid-roll, post-roll, and in-player overlays) delivered over the Internet. This excludes out-of-stream video advertising (e.g., video ads that play independently of video content, such as in-read and in-feed social video ad formats). This revenue is from advertiser spending.
The YouTube revenue figure represents YouTube in-stream video advertising revenue, which comprises revenue generated through the delivery of in-stream video advertising (i.e., pre-roll, mid-roll, post-roll, and in-player overlays) on YouTube. This does not include revenue generated by static display, dynamic display ads, or search ads delivered on the YouTube platform. This revenue is from advertiser spending.
The broadcaster company revenue figures represent the total in-stream video advertising revenue generated by the combined total of each player’s online video properties.
The Facebook revenue figure comprises revenue generated through the delivery of in-stream video advertising (i.e., mid-rolls) placed in videos viewed on the Facebook platform. This includes videos viewed within the News Feed, Suggested Videos, and Facebook’s recently launched Watch platform. This revenue is from advertiser spending.
Out-of-stream video advertising revenue comprises revenue generated through the delivery of out-of-stream advertising (i.e., video ads that are served outside of the video player). This includes in-feed video advertising on all social networks. It also includes out-of-stream video advertising placed on digital publishers’ sites and interstitial video advertising delivered within mobile apps. This revenue is from advertiser spending.
Mobile video advertising comprises revenue from in-stream video advertising (pre-rolls, mid-rolls, post-rolls) and out-of-stream video advertising delivered over the Internet to, viewed on, and formatted for mobile devices.
Desktop and laptop video advertising comprises revenue from in-stream video advertising (i.e., pre-rolls, mid-rolls, post-rolls) and out-of-stream video advertising delivered over the Internet to desktop PCs and laptops.
Connected TV video advertising comprises revenue from in-stream video advertising (i.e., pre-rolls, mid-rolls, post-rolls) delivered over the Internet to smart TVs, media streamers, game consoles, and connected set-top boxes.
Omdia has restated past years Internet-based video revenue estimates, to integrate newly publicly disclosed information from entities offering services and collecting revenues in Canada. This may affect year-over-year comparisons.
Numeris
Audience measurement data is important not only to industry stakeholders, who use the data to help sell airtime to advertisers, but also to the CRTC, which uses the data to assess the effectiveness of its policies by understanding the reach of programming across the country and across various demographics.
Television audience measurement data sourced from Numeris was collected by portable people meter (PPM) devices.
Prior to 2019-2020, radio audience measurement data was based on Numeris radio data from the fall surveys across Canada, Monday to Sunday from 5 a.m. to 1 a.m., with participants aged 12 or older. Due to the impact of the COVID-19 pandemic and its extenuating factors, Numeris was unable to produce the Fall 2020 Radio Release. Therefore, the Spring 2020 and Spring 2021 surveys were used in 2019-2020.
Spring 2020 measurement across Canada, Monday to Sunday from 5 a.m. to 1 a.m., with participants aged 12 or older.
Please note: contains no listening during the COVID-19 pandemic
Measurement of only the top 22 markets since Spring 2021, Monday to Sunday from 5 a.m. to 1 a.m., with participants aged 12 or older.
The Fall 2021 survey was used in 2020-2021. The Fall 2022 survey was used in 2021-2022.
The Numeris data presented by linguistic market divides Canada into two sections: (1) all of Canada, excluding Francophone respondents in Quebec; and (2) exclusively Francophones respondents in Quebec.
The television seasons used by Numeris were the following:
- 26 August 2013 to 31 August 2014, includes all persons 2+, Monday to Sunday, 2 a.m. to 2 a.m.
- 1 September 2014 to 30 August 2015, includes all persons 2+, Monday to Sunday, 2 a.m. to 2 a.m.
- 31 August 2015 to 28 August 2016, includes all persons 2+, Monday to Sunday, 2 a.m. to 2 a.m.
- 29 August 2016 to 27 August 2017, includes all persons 2+, Monday to Sunday, 2 a.m. to 2.a.m.
- 28 August 2017 to 26 August 2018, includes all persons 2+, Monday to Sunday, 2 a.m. to 2 a.m.
- 27 August 2018 to 30 August 2019, includes all persons 2+, Monday to Sunday, 2 a.m. to 2 a.m.
- 26 August 2019 to 30 August 2020, includes all persons 2+, Monday to Sunday 2 a.m. to 2 a.m.
- 31 August 2020 to 29 August 2021, includes all person 2+, Monday to Sunday 2 a.m. to 2 a.m.
- 30 August 2021 to 28 August 2022, includes all person 2+, Monday to Sunday 2 a.m. to 2 a.m.
The DMBU audiovisual figures used in the 2021-2022 broadcast year represent in-home Video Audience Measurement (VAM) of Numeris participating services. VAM data is collected using a FocalMeter, a small box attached to the participating household’s router that detects when Numeris participating stations and streaming services are watched on the internet through different digital devices. In the 2021-2022 broadcast year, only the Ontario market and the Quebec Francophone market were measured using VAM.
Definitions
AVOD refers to advertising video-on-demand service. This is an Internet-based service model in which a client typically has free access to content but is exposed to in-stream advertisements (e.g., YouTube and Facebook).
BDU revenues refers to revenues from basic and non-basic BDU services and excludes Internet-based service revenues, such as Netflix, Crave and Club Illico, but include Internet Protocol Television services such as Bell Fibe and Telus Optik TV.
Broadcasting contributions to Canadian content include Canadian content development (CCD) contributions, Canadian programming expenditures (CPE), contributions to the creation and production of Canadian programming from BDUs, and tangible benefits from ownership transactions in the form of CCD contributions and CPE.
Canadian programming expenditures refers to expenditures used to create Canadian programming and to ensure that a diversity of voices and interests are represented in our national broadcasting system. The policy objectives of the Broadcasting Act include encouraging the development of Canadian expression and ensuring that each element of the Canadian broadcasting system contributes to the creation and presentation of Canadian programming, in an appropriate manner. As such, Canadian broadcasters are required to allocate portions of their annual broadcasting revenues to expenditures on Canadian programming.
Canadian content development (CCD) contributions are financial contributions made by radio broadcasters to support the development and promotion of Canadian musical and spoken word content for broadcast.
Conventional TV refers to national broadcast television networks (i.e. CBC/SRC, Global, TVA).
Direct-to-home (DTH) refers to satellite service providers.
Discretionary services encompass all currently licensed services formerly known as pay and specialty services, pursuant to Broadcasting Regulatory Policy CRTC 2015-86.
Earnings before interest, taxes, depreciation and amortization (EBITDA) is a metric used to measure financial performance. It is expressed as a percentage of total revenues.
IPTV refers to Internet Protocol Television, such as Bell Fibe and Telus Optik TV, but excludes Internet-based services, such as Netflix, Crave, and Club Illico.
On-demand services encompass all licensed pay-per-view (PPV) and video-on-demand (VOD) services, pursuant to Broadcasting Regulatory Policy CRTC 2015-86.
PBIT refers to profit before interest and taxes.
Programs of national interest (PNI) are programs from the following categories: including drama and comedy, long-form documentary, and specific Canadian award shows that celebrate Canadian creative talent. For French-language broadcasters, PNI also include music video and variety programs:
- Long-form documentary (category 2b);
- Drama and comedy (category 7);
- Music and dance (including music video clips and music video programs) and variety (categories 8 and 9) in the French-language market; and
- English-language and French-language award shows (which fall under General entertainment and human interest [category 11]).
SVOD refers to subscription-based video-on-demand service. It is an Internet-based service model in which a client pays a subscription fee to gain access to a library of content. This category includes services that air the content of the library according to a linear schedule (e.g., Sportsnet Now) and services that permit a user to choose from a catalogue of content that is available at any time (e.g., Netflix and Amazon Prime Video).
Total broadcasting revenues include revenues from private commercial and CBC/SRC conventional television, discretionary and on-demand services, private commercial and CBC/SRC radio services, as well as BDUs. They do not include Internet-based services unless stated otherwise.
TVOD refers to transactional video-on-demand service. It is an Internet-based service model in which a client pays for specific content but generally does not pay to access the service itself (e.g., iTunes, Microsoft Movies & TV, and the PlayStation Network).
- Date modified: